Data Cubes
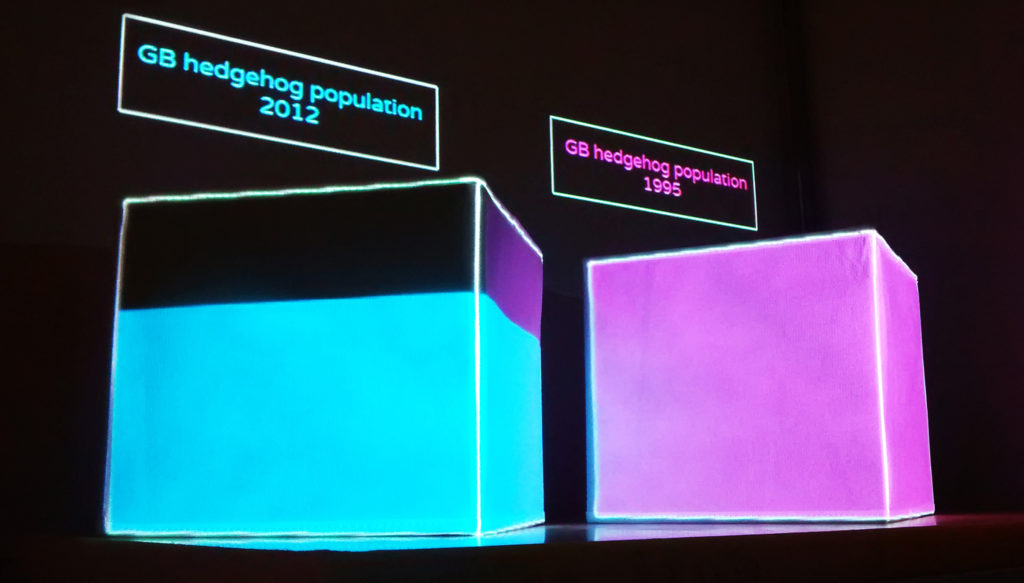


The world is full of interesting data and often all that is needed to understand it, is for it to be given context. One of the simplest ways to achieve this is by making comparisons between different quantities with the same scale or units. Data Cubes is an animated exhibit that uses this simple and accessible approach to convey a range of interesting statistics.
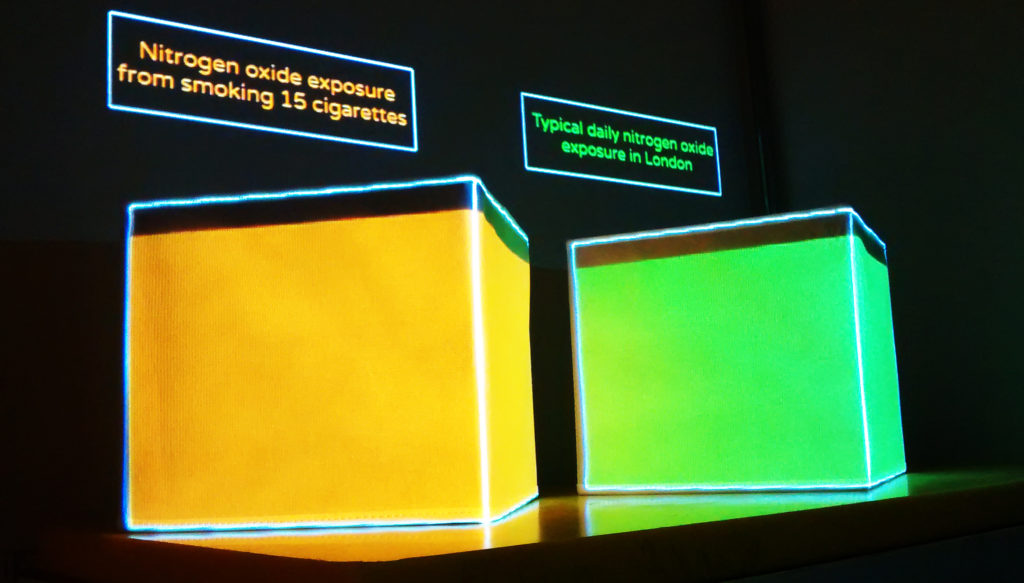
Using two canvas cubes, a projector and open-source projection mapping software, two different quantities can be compared. An animated 3D projection gradually ‘fills up’ each cube, allowing the difference between two colour coded quantities to be easily viewed and understood.
Other visualisations included the number of bibles printed each year vs the number of IKEA catalogues, and a comparison between UK renewable energy subsidies and UK fossil fuel subsidies.


